

Interpolation
As a first step, Meteonorm calculates monthly average values for six key climate parameters for a target location (latitude, longitude, and altitude):
- Global horizontal irradiance
- Air temperature
- Dew point temperature
- Wind speed
- Precipitation
- Number of days with precipitation
A standardized interpolation method is applied for all parameters, blending quality-controlled measurements from ground weather stations with high-resolution gridded data.
Measurements from ground weather stations provide local accuracy while gridded data provides global coverage. In non-polar regions, satellite data is used for global horizontal irradiance. In polar regions, and for the other parameters, ERA5 reanalysis data is used.
Distance-Based Blending
The core of the interpolation is a distance-based blending strategy. The influence of ground stations versus gridded data depends on the 3D weighted distance between the target location and the nearest station.
- Nearest station is closer than km: only data from the nearest station is used.
- Nearest station is between and away: data from up to six nearby stations is blended using the inverse distance weighting method described below.
- Nearest station is between and km away: station data is blended with gridded data. The weight of the station data decreases as the distance increases.
- Nearest station is more than km away: only gridded data is used.
| Parameter | |||
|---|---|---|---|
| Global horizontal irradiance | 2 | 10 | 50 |
| Temperature | 2 | 20 | 100 |
| Dew point temperature | 2 | 20 | 100 |
| Wind speed | 2 | 20 | 100 |
| Precipitation | 2 | 20 | 100 |
| No. of days with precipitation | 2 | 20 | 100 |
Table 1: Distance thresholds (in km) used for blending gridded and ground station data.
The following schema illustrates the blending logic:
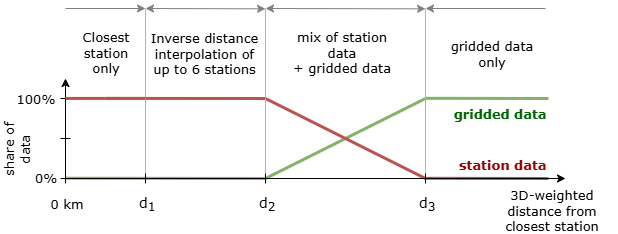 Figure 1: A visual representation of the blending logic based on the distance to the nearest station.
Inverse Distance Weighting
When multiple ground stations are used, a target time series is interpolated using a modified inverse distance weighting (IDW) method. This method takes into account both the horizontal distances between target and stations, and the differences in altitude, applying a parameter-specific vertical scale factor and gradient. For stations, the target value is the weighted average of the station values :
where
is the weight for station (note that we only consider stations with ),- is the horizontal distance between the target and station ,
- is the maximum search radius (see Table 2),
- is the vertical scaling factor ("altitude penalty", see Table 2),
- is the difference in altitude between the target and station ,
- is the vertical gradient (see Table 2).
| Parameter | Vertical Gradient ( ) | Vertical Scaling Factor ( ) | Max. Search Radius ( ) |
|---|---|---|---|
| Global horizontal irradiance | 0 | 100 | 150 km |
| Temperature | -0.5 °C / 100m | 200 | 300 km |
| Dew point temperature | -0.4 °C / 100m | 200 | 300 km |
| Wind speed | +0.2 m/s / 100m | 200 | 300 km |
| Precipitation | 0 | 200 | 300 km |
| No. of days with precipitation | 0 | 200 | 300 km |
Table 2: Parameter-specific factors for the IDW interpolation.