

Future data
Meteonorm 9 integrates future climate projections to support planning and decision-making under climate change. These projections are based on data from 15 global climate models from CMIP6 (Coupled Model Intercomparison Project Phase 6), using three future scenarios known as Shared Socioeconomic Pathways (SSPs) in combination with Representative Concentration Pathways (RCP):
- SSP1-2.6 (RCP 2.6): Optimistic scenario (low emissions, strong climate policies)
- SSP2-4.5 (RCP 4.5): Middle-of-the-road scenario (moderate policies)
- SSP3-7.0 (RCP 7.0): High-end scenario (limited climate action)
An extreme scenario, such as RCP 8.5 in Meteonorm 8, has not been included as it is meanwhile seen as too extreme and unrealistic.
The goal of future Climate TMY is not to predict exact future weather, but rather to provide statistically averaged climate trends, with minimized model uncertainty through the use of ensemble means.
Three parameters are modified for future scenarios: Air temperature, global irradiance and precipitation. All other parameters are kept constant. Only anomalies of 20 year averages (differences between the future and today’s climate) are stored. Anomaly fields have a spatial resolution of 1x1° and a temporal resolution of 10 years (e.g. 2050 represents the climate of 2041-2060). The anomalies are added to todays’s Meteonorm climate values for the chosen location and time period to obtain future climate values.
Global irradiance values show small to limited increases for SSP1-26 (only partially significant), minimal changes in SSP2-45 and global decrease in SSP3-70. This is due mainly to the change of aerosols (de-fossilizing also leads to lower emission of aerosols).
For temperature, all scenarios project significant warming, with strongest increases in the Arctic due to sea ice melt and positive feedback mechanisms. For precipitation there are increasing trends, especially near the equator and polar regions.
Future data can be accessed by setting the future_scenario and future_year query
parameters in the /climate/tmy endpoint.
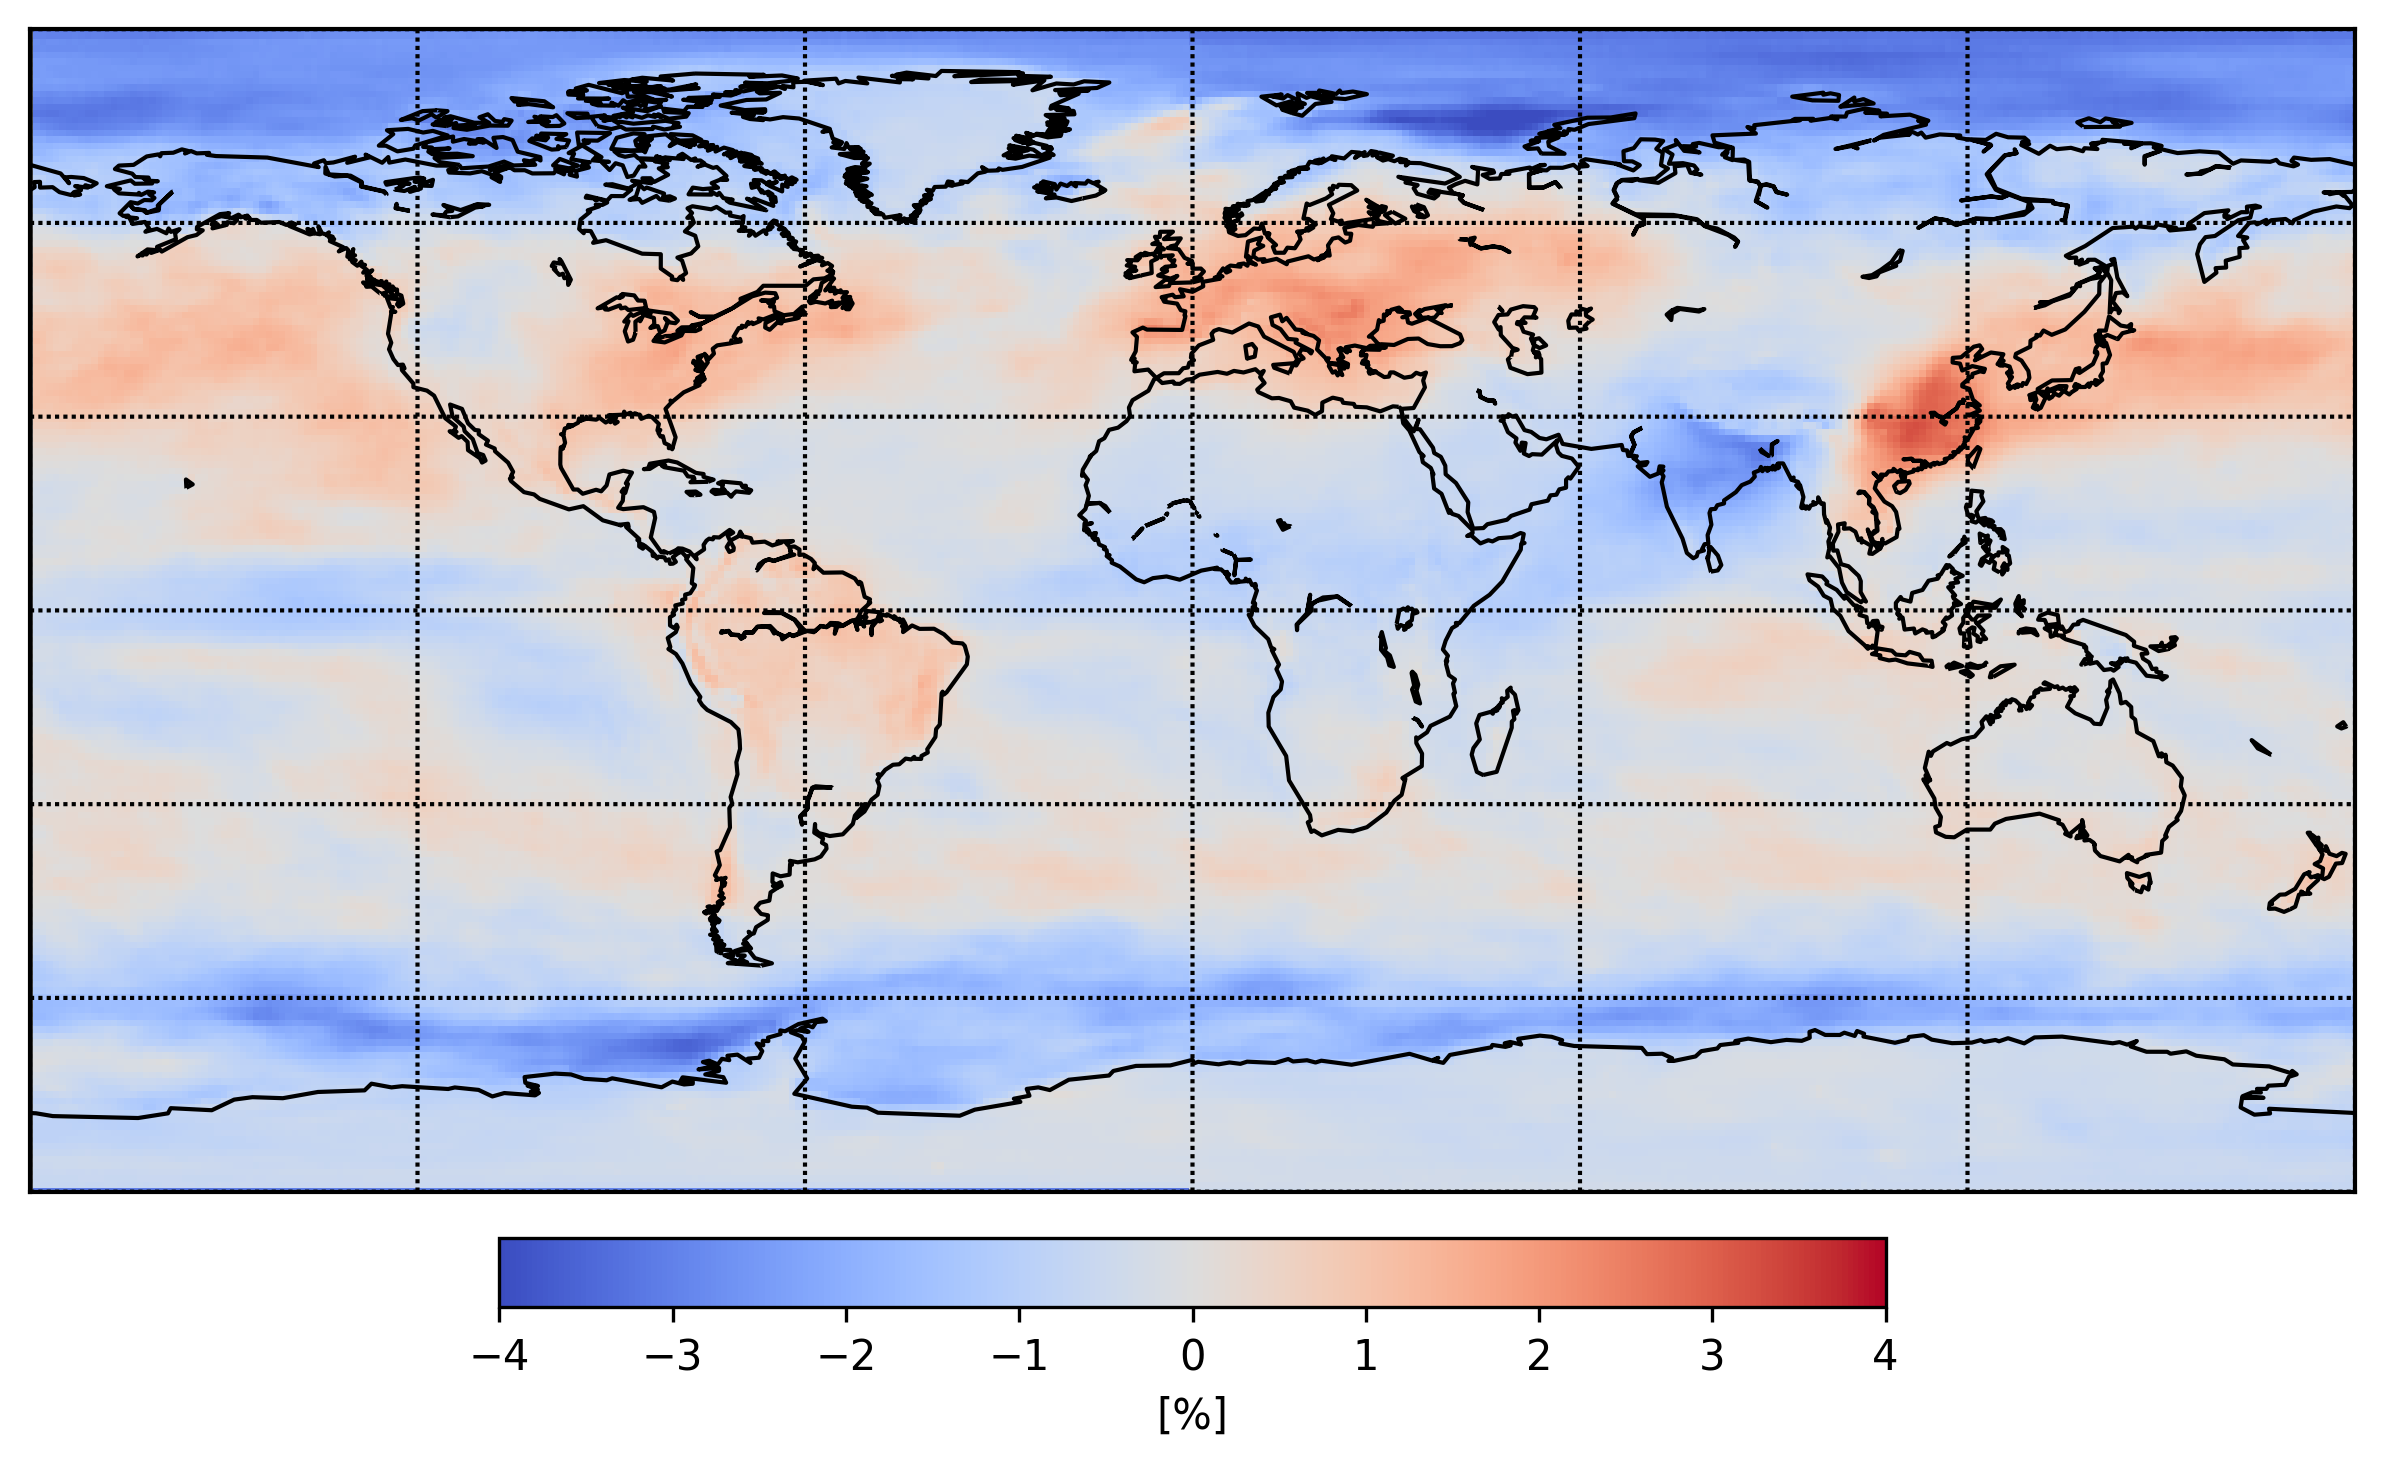 Figure 1: Anomalies for GHI and scenario SSP2-45 for 2050 (2041-60) compared to 2001-20.